

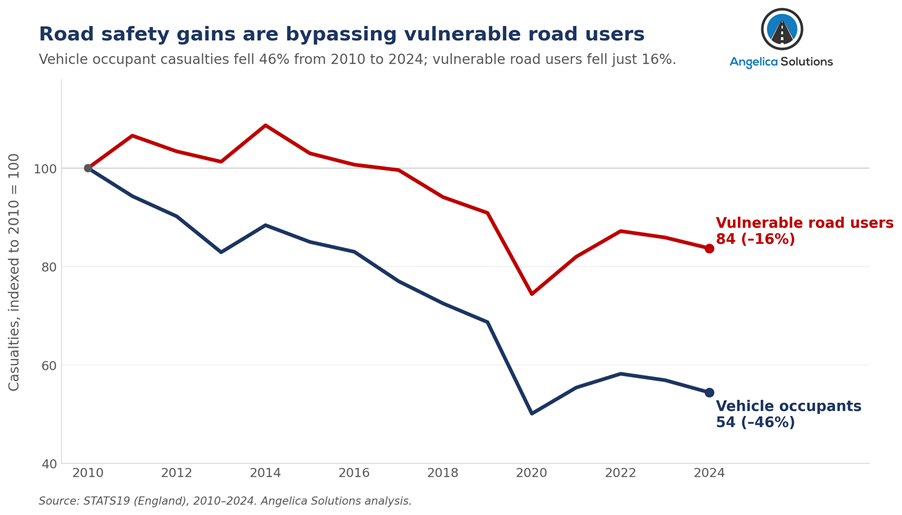
New analysis of STATS19 police collision data by Angelica Solutions reveals a widening road safety gap. While casualties among people travelling inside vehicles have fallen by 46% since 2010, vulnerable road users [1] only saw a 16% reduction over the same period, meaning they now account for a larger share of those killed or seriously injured (KSI) on England’s roads. The findings come as the Government commits £4.5 billion through its latest Cycling and Walking Investment Strategy [2] which aims to increase the proportion of short journeys made by walking, wheeling and cycling from 48% to 55%, while increasing the number of children who usually walk or cycle to school from 47% to 60%.
The analysis demonstrates that while road safety has improved overall, the benefits have not been shared equally. Advances in vehicle safety have significantly reduced casualties among drivers and passengers, but progress for pedestrians, cyclists, motorcyclists and other vulnerable road users has been far more modest. As more people are encouraged to walk and cycle, the findings suggest that without further improvements to road safety, the overall number of serious casualties could continue to rise despite individual risk levels gradually improving.
Vulnerable road users have gone from accounting for around three in every ten road casualties (of any severity) in 2010 to four in every ten in 2024. They account for 57% of everyone killed or seriously injured on England’s roads over that period.
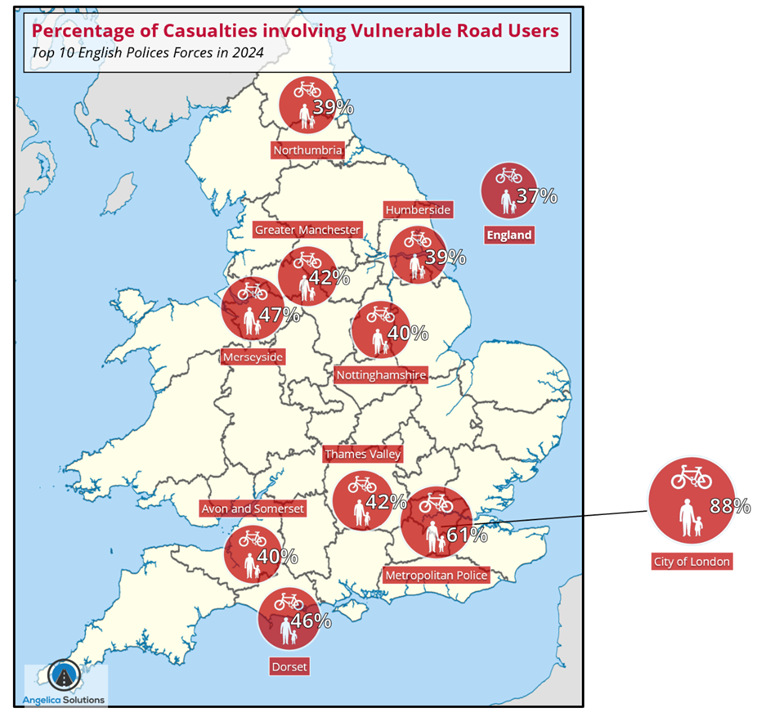
The upward trend is reflected across every police force area in England with all 39 forces seeing an increase, with London seeing the most extreme rise from an already-high base (City of London 78%→88%, Metropolitan Police 47%→61%). Other regions similarly have experienced sharp increases in the proportion of casualties involving vulnerable road users between 2010 and 2024.
- Merseyside: 24% to 47%
- Thames Valley: 25% to 42%
- Northumbria: 24% to 39%
- Durham: 23% to 37%
- Cheshire: 24% to 36%
- Nottinghamshire: 28% to 40%
“The findings raise important questions as the Government seeks to encourage more active travel. Under its latest Cycling and Walking Investment Strategy, ministers aim to increase the proportion of short urban journeys made by walking, wheeling and cycling from 48% to 55%, while increasing the number of children who usually walk or cycle to school from 47% to 60%. Our analysis suggests that unless road safety improvements keep pace with these ambitions, encouraging more people onto the roads could lead to an increase in the overall number of serious casualties”, warns Sarah Vaughan, Director of Angelica Solutions.
The business modelled the impact of a 50% increase in walking and cycling, while holding today’s injury rates constant. The analysis suggests this could result in around 4,700 additional pedestrians and cyclists being killed or seriously injured each year in England.
“It’s not that our roads are becoming more dangerous, it’s that they’re becoming safer at different speeds depending on how you travel. We’ve made enormous progress protecting people inside vehicles through advances in vehicle safety, but pedestrians, cyclists and other vulnerable road users haven’t benefited to the same extent. If we want more people to choose active travel, we need to ensure investment in walking and cycling is matched by effective investment in making those journeys safer. Otherwise, we risk widening an already significant road safety gap,” concludes Sarah Vaughan.
Methodology
- Analysis is based on STATS19, the national police record of road collisions, using the full casualty record for England from 2010 to 2024. Every casualty was assigned to one of two groups, vulnerable road users or people travelling inside vehicles, based on the type of road user.[3]
- For the national picture, casualties in each group are counted for each year and expressed as a share of the total, so that changes in the mix of who is being hurt could be tracked over time. This was calculated on two bases: all casualties, and only those killed or seriously injured,[4] so that the trend in overall casualties could be distinguished from the trend in the most serious ones. Each group is indexed to its 2010 level to compare the pace of change between the two groups directly.
- For the regional picture, the same share calculation was repeated separately for each of the 39 English police force areas, for 2010 and for 2024. The percentage point change between the two years was calculated and the police forces then ranked from largest to smallest change.[5] The national and regional figures draw on the same casualty groupings, so they are consistent with one another.
- To illustrate the possible effect of growth in active travel, we built a scenario that scales up pedestrian and cyclist casualties in line with a given increase in walking and cycling, while holding the rate of injury per person at its current level.[6] We report the ‘50% increase’ case.
- This is an illustrative scenario. The rate of injury per person could move in either direction as activity grows. It may fall as greater numbers improve driver awareness and active travel safety or rise as routes become more congested and less experienced walkers and cyclists take to the roads. We therefore hold the rate constant as a neutral assumption.
[1] Vulnerable Road users – pedestrians, cyclists, e-scooter & e-bike riders, motorcyclists, horse-riders and mobility scooters
[2] https://www.gov.uk/government/news/cycling-and-walking-boom-with-45-billion-for-thousands-of-new-routes-and-safer-crossings
[3] Vulnerable road users are pedestrians, cyclists (including e-bikes), motorcyclists, horse riders and mobility scooter users (STATS19 casualty types 0, 1, 2, 3, 4, 5, 16, 22, 23, 97). People inside vehicles are car, taxi, bus, minibus, van and goods vehicle occupants (types 8, 9, 10, 11, 19, 20, 21, 98). E-scooters do not have individual codes in STATS19 but are stated by Gov.uk to be included as a ‘vulnerable’ vehicle.
[4] For killed or seriously injured (KSI), figures used are the STATS19 adjusted severity measure, which corrects for changes in how forces have recorded injury severity over time, so that trends are not distorted by reporting changes.
[5] Each force is identified from the force recorded against the collision. The vulnerable road user share of casualties for each force in each year is used, rather than raw counts, so that forces of very different sizes can be compared on a like-for-like basis.
[6] Serious-injury rates by group were pooled over 2022 to 2024 to give a stable recent figure. The scenario grows only pedestrian and cyclist casualties, in proportion to the modelled rise in walking and cycling and holds every other group and the underlying injury rate unchanged. Holding the rate constant is considered reasonable, as the rate has improved only marginally over the past decade.